Did adaptive growth change tree sway patterns 10 years after thinning?
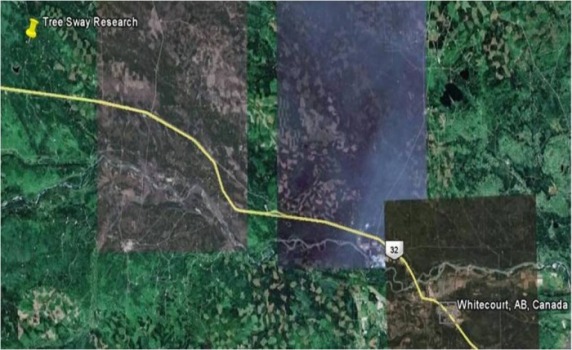
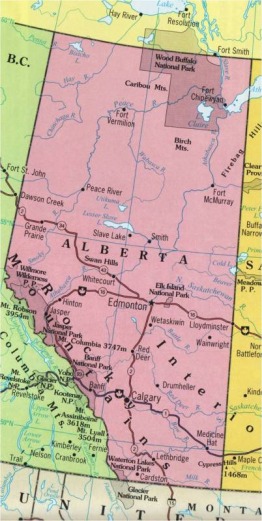
Figure 1: Site location. (Google Maps, 10/31/09)
The study site is located approximately 50 km northwest of Whitecourt, Alberta. Data collection for this study began in June 2009 when biaxial clinometers were re-installed on the 10 selected trees from the original study.
At this, time a monitoring system contained a data logger and a 19 meter tall tower were also installed within the stand. Each biaxial clinometer provided data on the tilt within the x, y-axis for an individual tree, while the anemometer attach to the top of the tower provided data on wind speed and direction.
Recording of tree sway data was triggered when the 3 minute - average wind speed reached the set threshold speed. Approximately 37 hours of data was collected throughout the 2009 summer.
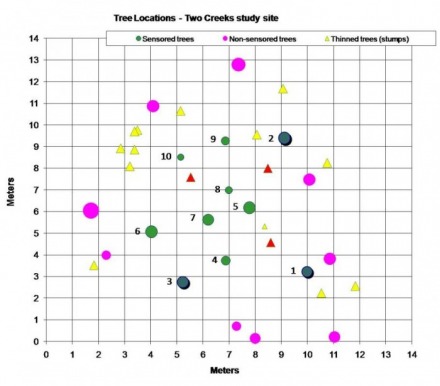
Figure 2: Map identifying tree location.
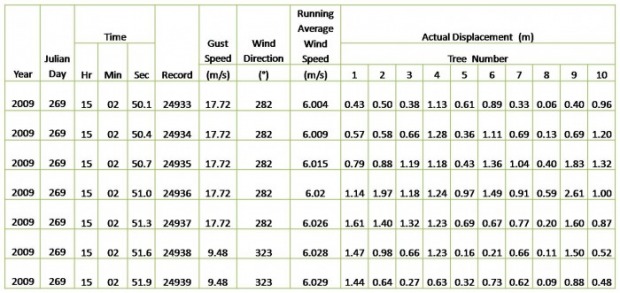
Table 1: Sample of data collected after being converted to actual displacement in meters. Under windy conditions, data on tilt, wind speed, wind direction were collected at a rate of 3 lines per a second (0.3Hz).
Time segments selected for analysis in this study were based on minimum periods of 1 minute containing similar wind speed and wind direction for both the 1999 and 2009 data. Using this method, approximately 19,19,14 minutes of data was selected for the 1999 data set, while 17, 18, 10 minutes of data was selected for the 2009 data set at average wind speed of 4, 5, 6 m/sec, respectively.
After converting the raw data from values of millivolts to displacement in meters on the x, y-axis, Pythagoras theorem (c ^2=a^2 + b^2) was applied to calculate the actual distance traveled by the crown. The average displacement was calculated for each wind speed over the entire selected time segment.
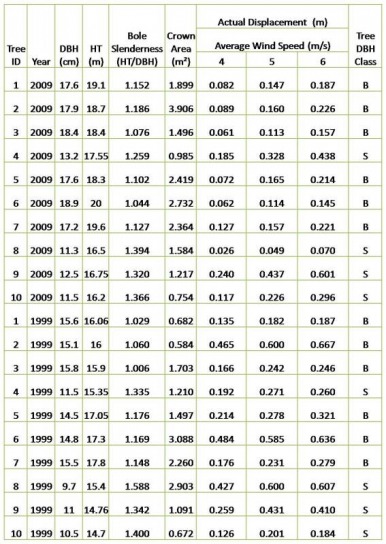
Table 2: Data table showing stand measurements from 1999 and 2009.
For this study, sampling units are the individual trees numbered 1 through 10. The predictor variables, which were observed, include DBH, height, crown area, and slenderness coefficient. The response variable is amount of displacement represented as an average value The DBH classification, big or small, was used to subset data allowing for comparison of growth between trees with similar characteristics.
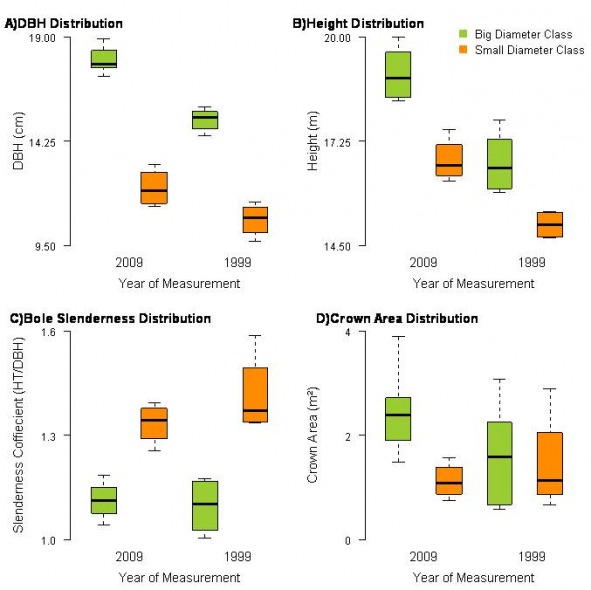
Figure 3: Distribution of predicting variables according to measurement years 1999 and 2009.
It can be seen from Figure 3, that DBH and HT substantially increased after the thinning treatment for both the big and small DBH classes. Increased growth was an expected result within this study, and is often the primary reason forest industries implement thinning practices.
A decrease in bole slenderness was another expected result of the thinning treatment and is an indicator of re-allocation of carbohydrate to bole thickening in order to compensate for increased crown sway. However, the anticipated result only held true for trees within the smaller tree class. The slenderness distribution at the big tree class showed a reduction in width (Q1 and Q3 becoming closer) but remained at approximately the same level after the thinning treatment, suggesting height and diameter growth at the big tree class remained proportionate after thinning.
Crown area was also expected to increase which occurred only at the big tree class. The opposite result, a decrease in crown area, occurred at the small tree class suggesting that crown abrasion (loss of leaf area through breakage) may be a factor.
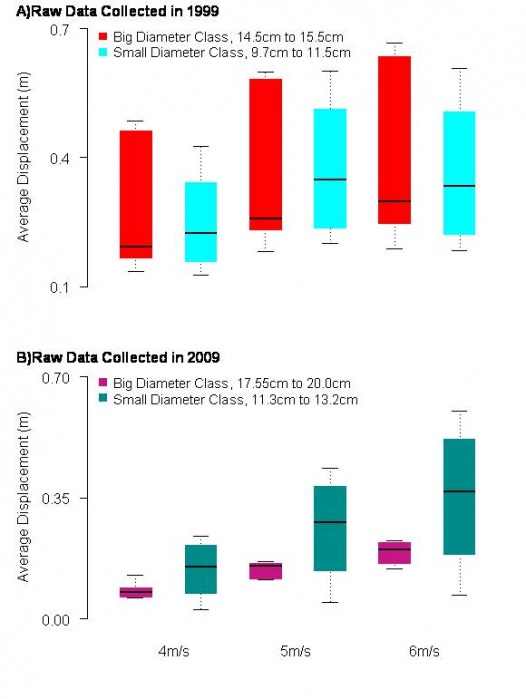
Figure 4: Distribution of the average crown displacement in each diameter class at given wind speeds of 4, 5, and 6 meters per second for both measurement years.
Average displacement rates for the sensored trees have declined over time for both the small and big DBH class, with the greatest reduction occurring at the large tree level. Although the small DBH class also shows a decline in average displacements, the decline is not nearly as large as within the larger tree classes. This lack of resistance to wind forces is substantiated by the reduction in crown area seen in Figure 3.D.
Disclaimer: this is a class exercise based on modified or randomly generated datasets
