Did adaptive growth change tree sway patterns 10 years after thinning?
Before performing any statistical analysis, raw data was checked for normality using a range of methods. A histogram provided visual representation of the raw data points, while Shapario – Wilk’s test was performed individually on each of the predicting and response variables in order to identify any departures from normality. Following the distribution test, variables were paired and tested using a Bartlett test in order to examine variable variances. P-values below 0.05 were considered as having departures from normality and unequal variance for both the Shapario – Wilk’s and Bartlett tests. From the initial distribution tests, the following variables were identified as having abnormal distribution: a) 1999 - 4m/s displacement; b) 1999 – 5m/s displacement; c) 1999 - DBH; d) 2009 – DBH; and only one identified as having unequal variances: e) 4 m/s displacement as a function of measurement year.
To meet the normality requirements of the statistical test, attempts were made to transform the abnormal variables. All but one variable (DBH) was successfully transformed using various transformation methods. The transformed data was once again tested for normality using a histogram and Shaprio – Wilk’s test of residuals; no departures from normality or variance were identified. Although the displacement at 6 m/s data met the requirements the normality and equal variance for both 1999 and 2009 when tested separately, tests on residuals did not meet normality requirements. As such, the displacement at 6 m/s was also transformed.
Statistical analysis comparing the 1999 and 2009 data point was performed using a paired t-test. The paired t-test is ideal for experiential designs where individual sampling units are repeatable tested in a “before and after” model. Using this method, difference between the “before and after” measurements are analyzed for significance. P-values below a threshold value of 0.05 identify significance between the “before and after” variable. Because both the 1999 – DBH and 2009 – DBH measurements did not have normality or equal variances even after transformation attempts, a Kolmogorov – Simrnov test was used to compare these to variables.
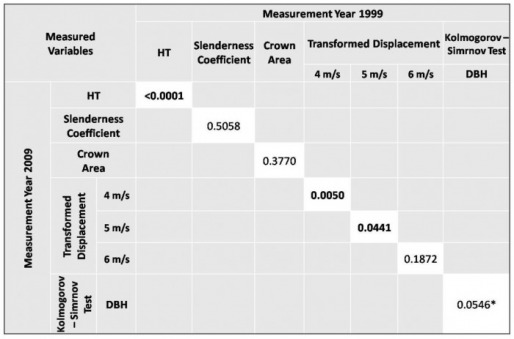
Table 3: Resulting p-values from paired t-test based on comparison between 1999 and 2009 data. Significance indicated by bold lettering. Asterisk represents a potential for significance with larger sample size.
The initial results from the paired t-test based on the comparison of 1999 and 2009 data showed significance between height, 4 m/s displacement, and 5 m/s displacement. However, because these results only partial coincided with the differences seen in Figures 2 and 3, further testing was performed in order to isolate the specific variable producing significance. The paired t-tests were performed again this time comparing 1999 and 2009 data based on DBH classification. Results can be seen in Table 4.
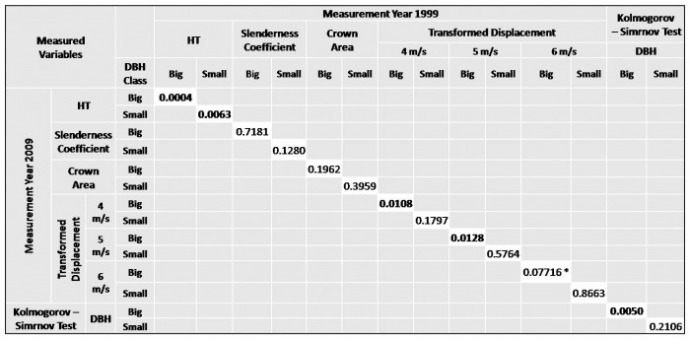
Table 4: Resulting p-values from paired t-test based on comparison between big and small DBH classes by measurement year.
Significance indicated by bold lettering. Asterisk represents a potential for significance with larger sample size.
Significance indicated by bold lettering. Asterisk represents a potential for significance with larger sample size.
When comparing variables based on DBH class, significance was found in five paired cases, all except one being found at a big DBH class level. The paired tests resulting in significance include, a) DBH class big – height; b) DBH class small – height; c) DBH class big – 4 m/s displacement; e) DBH Class big – 5 m/s displacement; and f) DBH class big – DBH. With a larger sample size, a significant difference may also have been found for the big DBH class at a 6 m/s displacement level. The differences between variables with significance were plotted and can be seen in Figure 5.
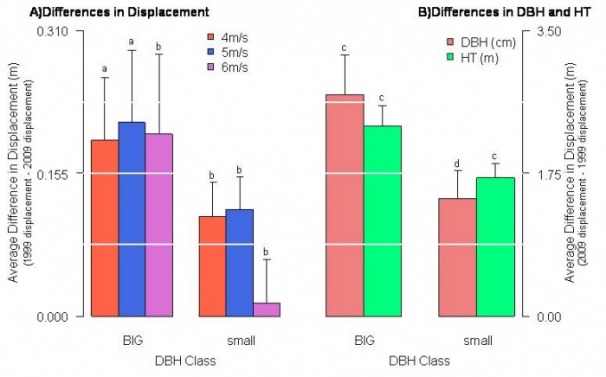
Figure 5: Averaged differences between 1999 and 2009 measurements by DBH class for variables shown to have significance through paired tests. Error bars represent standard errors calculated from raw data, while letters represent significances found during paired t-test on transformed data.
Disclaimer: this is a class exercise based on modified or randomly generated datasets
